Map Control
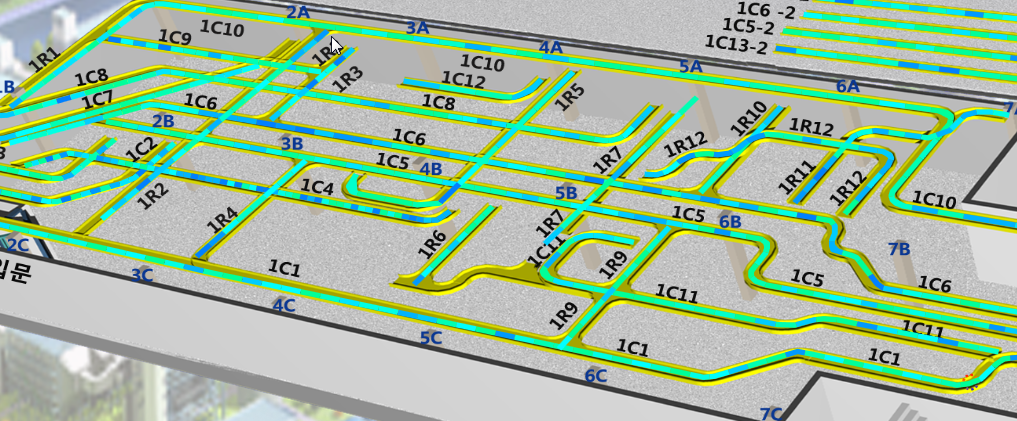
The program controls that allow the user or developer can simply draw color graph that corresponds to the temperature at the map.
【Figure: Map control sample capture】
Users can display the temperature graph in the Zone map or edit, if you save the edited contents are linked directly with temperature data allows the expression of colors on the screen 1M unit temperature.
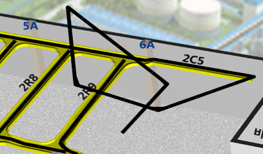
【Figure: Path drawing】
A new way to enter coordinates instead of the old way, by drawing a path increases with the mouse on the drawing (Path Drawing) data formation can easily coordinate information.
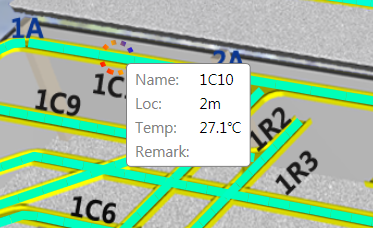
【Figure: Equip infomation】
When you place the mouse cursor on the facility shows the details of the equipment.
Other Enlarge / Reduce / basic operation such as moving the mouse only operation easy.
【Figure : Area graph】
Area graph tells you that an alarm has occurred from the elements by changing the color of the area in the event of an alarm to the user's boredom reduces the animation effect.
Click on this area, you can also go directly to the sub-map.
The map controls can be supplied to the company as a convenient control that supports a DTS application.

Operating Environment
Development environment : VS.NET & Winform / WPF
Deployment environment : Windows XP 이상
Framework : .NET Framework 3.0 이상
Supply to.
Software developers using the DTS
Features
- Temperature line drawing
- Drawing Shortcuts area
- Show Zone information
- Map Zoom / Move
- Show Hot spot
- Alarm position shortcut
- Configure Temperature color
- Changed data apply as real-time
- Expression and the operation point on the map up to 1,000,000